Derivatives and extreme function values
One major mathematical concept derivatives allow us to achieve is finding extreme function values. In Algebra 1, you may have learned how to find the vertex of a parabola, and that it is the minimum or maximum (extreme value) of the function. An extreme value is not necessarily the absolute highest or absolute lowest value on a graph, but the places where the function changes direction. Also in Algebra, you began to discuss slope as it pertains to a function increasing or decreasing. Recall that a function is increasing when the slope is positive and decreasing when the slope is negative. We must apply this to our study of derivatives prior to discussing how to find extreme values.
Increasing/Decreasing
Derivatives are instantaneous rates of change, or slopes of the curve at each point on the curve. That means the sign of derivative value can tell us whether the function is increasing or decreasing at that point. If the derivative is positive at an x-value, the function is increasing at that location. If the derivative is negative at an x-value, the function is decreasing at that location.
Derivatives are instantaneous rates of change, or slopes of the curve at each point on the curve. That means the sign of derivative value can tell us whether the function is increasing or decreasing at that point. If the derivative is positive at an x-value, the function is increasing at that location. If the derivative is negative at an x-value, the function is decreasing at that location.
Extreme Values
Since the derivative gives us locations where the function is increasing or decreasing, it can also help us determine where the function changes direction (or has possible extreme values). In order for the function to have an extreme value, the function must exist (not an asymptote, hole, or oscillation) and change direction.
These direction changes will happen where the derivative changes sign. In order for the derivative to change sign, it must either equal zero or be undefined. So, if we find the x-values where the derivative equals zero or is undefined, these will be all our possible locations for a change in direction in the original function. These x-values are called critical numbers.
Next, we have to determine whether the function changes direction on the graph or simply levels off at each of these critical numbers. To do this, we have two choices, the First Derivative Test or the Second Derivative Test.

Graph created using www.desmos.com.
In the First Derivative Test, we will test an x-value on each side of our critical x-value in the first derivative and observe whether the derivative sign value changes. If the first derivative sign changes from positive to negative, the original function changes from increasing to decreasing, which yields a relative maximum. A relative minimum occurs when the first derivative sign changes from negative to positive, when the original function changes from decreasing to increasing.
In the First Derivative Test, we will test an x-value on each side of our critical x-value in the first derivative and observe whether the derivative sign value changes. If the first derivative sign changes from positive to negative, the original function changes from increasing to decreasing, which yields a relative maximum. A relative minimum occurs when the first derivative sign changes from negative to positive, when the original function changes from decreasing to increasing.
Graph created using www.desmos.com.
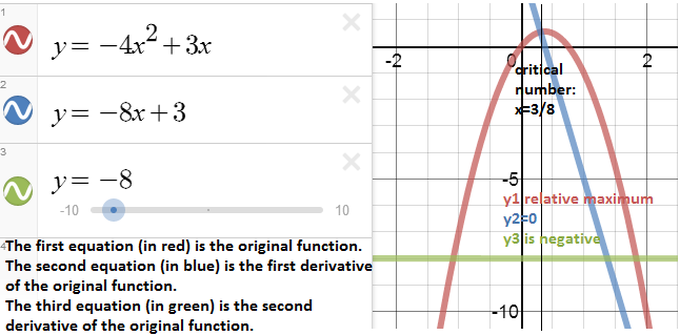
In the Second Derivative Test, instead of testing two values, we will test the critical number in the second derivative. If the critical number yields a negative second derivative value, the original function is concave down, which creates a relative maximum. The original function has a relative minimum when it is concave up, which occurs if the critical number yields a positive second derivative.

Graph created using www.desmos.com.
Keep in mind, the function does not have to have an extreme value, just because the first derivative was zero or undefined; not all critical numbers will be x-values of extrema! Also, remember the critical values have to work in the original equation; they can't be undefined x-values in the original function.
Keep in mind, the function does not have to have an extreme value, just because the first derivative was zero or undefined; not all critical numbers will be x-values of extrema! Also, remember the critical values have to work in the original equation; they can't be undefined x-values in the original function.
Finally, after you determine whether each critical number causes a relative minimum, relative maximum, or neither, to find the actual extreme value(s), substitute each critical number into the original function to find each corresponding y-value. Relative minimums and maximums must be y-values.
In general, to determine extreme values of a function:
- Find the critical numbers.
- Test each critical number using the First or Second Derivative Test to determine whether each critical number yields a relative maximum, relative minimum, or neither.
- Evaluate the function at each critical number that yields an extreme value to determine the relative minimum(s) and relative maximum(s).
Ready for practice?
Drexel University offers a wonderful, comprehensive practice worksheet on increasing/decreasing intervals and extreme function values. Be ready for problems that require analysis of graphs, not just equations. This page will open a .pdf file.
Drexel Derivatives
University of California also created a wonderful practice page. These problems extend the concept of an extreme value to applications. These will probably be challenging problems, but detailed solutions are provided.
University of California Optimization Problems
Drexel Derivatives
University of California also created a wonderful practice page. These problems extend the concept of an extreme value to applications. These will probably be challenging problems, but detailed solutions are provided.
University of California Optimization Problems
